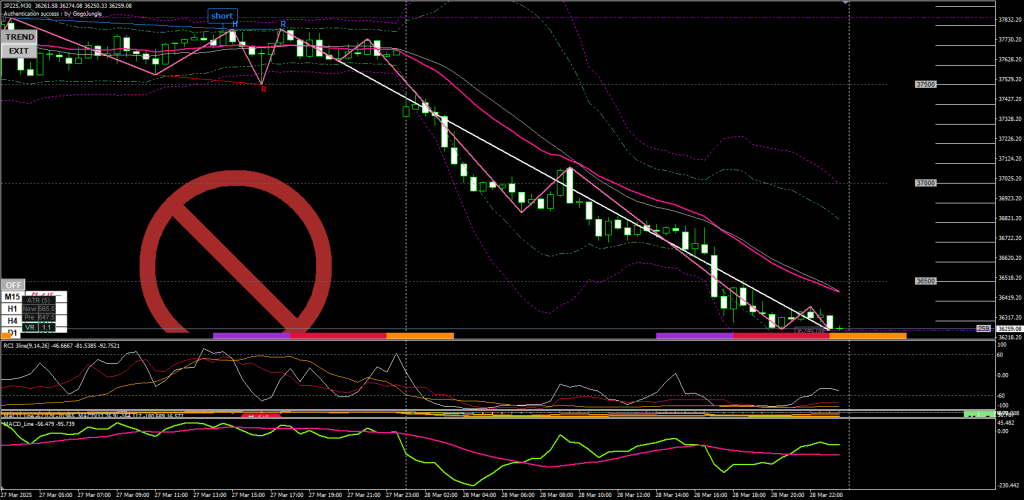
このツールでは、ユーザーが移動平均の期間(n)と終値データを入力し、ボリンジャーバンド(中心線、±1σ、±2σ、±3σ)を計算して結果を表示します。簡便さを優先し、終値データを手入力する形式にしますが、大量データの処理も考慮して柔軟に設計します。
ボリンジャーバンド計算ツール
コードはこちら
<!DOCTYPE html>
<html lang="ja">
<head>
    <meta charset="UTF-8">
    <meta name="viewport" content="width=device-width, initial-scale=1.0">
    <title>ボリンジャーバンド計算ツール</title>
    <style>
        /* ツール内部のみリセット */
        .bollinger-tool-container * {
            margin: 0;
            padding: 0;
            box-sizing: border-box;
        }
        .bollinger-tool-container {
            display: block; /* 親ページのレイアウトに影響を与えない */
            position: static; /* 親ページのpositionに影響されない */
            width: 100%;
            max-width: 600px;
            margin: 20px 0 0 150px; /* 左寄せ(左マージン150px) */
            background-color: #fff;
            padding: 20px;
            border-radius: 8px;
            box-shadow: 0 2px 4px rgba(0,0,0,0.1);
            font-family: Arial, sans-serif;
        }
        .bollinger-tool-container h1 {
            font-size: 24px;
            color: #333;
            text-align: left; /* 左寄せ */
            margin-bottom: 20px;
            width: 100%;
        }
        .bollinger-tool-container .input-group {
            display: flex;
            align-items: center;
            margin: 10px 0;
            width: 100%;
        }
        .bollinger-tool-container label {
            width: 130px;
            font-size: 16px;
            color: #333;
            font-weight: bold;
        }
        .bollinger-tool-container input,
        .bollinger-tool-container textarea {
            flex: 1;
            max-width: 300px;
            padding: 8px;
            font-size: 16px;
            border: 1px solid #ccc;
            border-radius: 4px;
        }
        .bollinger-tool-container textarea {
            height: 100px;
            resize: vertical;
        }
        .bollinger-tool-container button {
            display: block;
            width: 160px;
            margin: 20px auto;
            padding: 10px;
            background-color: #4CAF50;
            color: white;
            font-size: 16px;
            border: none;
            border-radius: 4px;
            cursor: pointer;
        }
        .bollinger-tool-container button:hover {
            background-color: #45a049;
        }
        .bollinger-tool-container #result {
            width: 100%;
            padding: 15px;
            margin-top: 20px;
            background-color: #f9f9f9;
            border: 1px solid #ddd;
            border-radius: 4px;
            font-size: 16px;
            min-height: 50px;
        }
        .bollinger-tool-container #result p {
            margin: 5px 0;
        }
        .bollinger-tool-container .error {
            color: red;
            text-align: center;
            font-size: 16px;
            margin: 10px 0;
        }
        /* モバイル対応 */
        @media (max-width: 768px) {
            .bollinger-tool-container {
                margin: 20px 0 0 20px; /* モバイルでは左マージン縮小 */
                max-width: 90%;
            }
        }
    </style>
</head>
<body>
    <div class="bollinger-tool-container">
        <h1>ボリンジャーバンド計算ツール</h1>
        <div class="input-group">
            <label for="period">移動平均の期間 (n):</label>
            <input type="number" id="period" placeholder="例: 20" min="2" step="1" required>
        </div>
        <div class="input-group">
            <label for="prices">終値データ (カンマ区切り):</label>
            <textarea id="prices" placeholder="例: 39000,39100,39200,...,40000" required></textarea>
        </div>
        <button onclick="calculateBollingerBands()">計算する</button>
        <div id="result"></div>
    </div>

    <script>
        function calculateBollingerBands() {
            const periodInput = document.getElementById('period');
            const pricesInput = document.getElementById('prices');
            const resultDiv = document.getElementById('result');

            const period = parseInt(periodInput.value);
            let prices = pricesInput.value
                .split(',')
                .map(p => parseFloat(p.trim()))
                .filter(p => !isNaN(p));

            if (!periodInput.value || isNaN(period) || period < 2) {
                resultDiv.innerHTML = '<p class="error">期間は2以上の整数を入力してください。</p>';
                return;
            }
            if (prices.length < period) {
                resultDiv.innerHTML = `<p class="error">終値データは${period}個以上必要です。</p>`;
                return;
            }

            const data = prices.slice(-period);

            try {
                const sma = data.reduce((sum, val) => sum + val, 0) / period;
                const variance = data.reduce((sum, val) => sum + Math.pow(val - sma, 2), 0) / period;
                const sigma = Math.sqrt(variance);

                const bands = {
                    plus1Sigma: sma + sigma,
                    minus1Sigma: sma - sigma,
                    plus2Sigma: sma + 2 * sigma,
                    minus2Sigma: sma - 2 * sigma,
                    plus3Sigma: sma + 3 * sigma,
                    minus3Sigma: sma - 3 * sigma
                };

                // 結果表示の順序を+3σ, +2σ, +1σ, -1σ, -2σ, -3σに変更
                resultDiv.innerHTML = `
                    <p><strong>移動平均 (SMA):</strong> ${sma.toFixed(2)} 円</p>
                    <p><strong>+3σ:</strong> ${bands.plus3Sigma.toFixed(2)} 円</p>
                    <p><strong>+2σ:</strong> ${bands.plus2Sigma.toFixed(2)} 円</p>
                    <p><strong>+1σ:</strong> ${bands.plus1Sigma.toFixed(2)} 円</p>
                    <p><strong>-1σ:</strong> ${bands.minus1Sigma.toFixed(2)} 円</p>
                    <p><strong>-2σ:</strong> ${bands.minus2Sigma.toFixed(2)} 円</p>
                    <p><strong>-3σ:</strong> ${bands.minus3Sigma.toFixed(2)} 円</p>
                `;
            } catch (error) {
                resultDiv.innerHTML = '<p class="error">計算中にエラーが発生しました。入力データを確認してください。</p>';
                console.error('Error:', error);
            }
        }
    </script>
</body>
</html>
コードの説明
- HTML構造:
- 期間入力: 移動平均の期間(n)を指定(例: 20)。
- 終値入力: 終値をカンマ区切りで入力するtextarea(例: 39000,39100,…)。
- 計算ボタン: クリックで計算を実行。
- 結果表示: 計算結果(SMA、±1σ、±2σ、±3σ)を表示。
- CSS:
- シンプルで視認性の高いデザイン。
- 入力欄は広めに設定し、textareaで複数データを扱いやすく。
- 結果は枠付きで読みやすく表示。
- JavaScript:
- 入力処理: 終値データをカンマ区切りでパースし、数値配列に変換。
- バリデーション: 期間が2以上か、データ数が期間以上かをチェック。
- 計算:
- 移動平均(SMA): 最新n期間の終値の平均。
- 標準偏差(σ): 終値とSMAの差の二乗平均の平方根。
- バンド: SMA ± kσ(k=1, 2, 3)。
- 出力: 結果を小数点以下2桁で円単位表示。
- 計算式:
- SMA: ∑Cin\frac{\sum C_i}{n}
\frac{\sum C_i}{n} - σ: ∑(Ci−SMA)2n\sqrt{\frac{\sum (C_i – SMA)^2}{n}}
\sqrt{\frac{\sum (C_i - SMA)^2}{n}} - バンド: SMA±k⋅σSMA \pm k \cdot \sigma
SMA \pm k \cdot \sigma(k=1, 2, 3)
- SMA: ∑Cin\frac{\sum C_i}{n}
使い方
- コードをbollinger_calculator.htmlとして保存。
- ブラウザで開く。
- 例:
- 期間: 20
- 終値データ: 39000,39100,39200,39300,39400,39500,39600,39700,39800,39900,40000,40100,40200,40300,40400,40500,40600,40700,40800,40900
- 「計算する」をクリック。
シミュレーション例
入力:
- 期間: 5
- 終値: 39000,39100,39200,39300,39400
計算:
- SMA: 39000+39100+39200+39300+394005=39200\frac{39000 + 39100 + 39200 + 39300 + 39400}{5} = 39200
\frac{39000 + 39100 + 39200 + 39300 + 39400}{5} = 39200 - σ: (39000−39200)2+(39100−39200)2+(39200−39200)2+(39300−39200)2+(39400−39200)25≈141.42\sqrt{\frac{(39000-39200)^2 + (39100-39200)^2 + (39200-39200)^2 + (39300-39200)^2 + (39400-39200)^2}{5}} \approx 141.42
\sqrt{\frac{(39000-39200)^2 + (39100-39200)^2 + (39200-39200)^2 + (39300-39200)^2 + (39400-39200)^2}{5}} \approx 141.42 - バンド:
- +1σ: 39200+141.42≈39341.4239200 + 141.42 \approx 39341.42
39200 + 141.42 \approx 39341.42 - -1σ: 39200−141.42≈39058.5839200 – 141.42 \approx 39058.58
39200 - 141.42 \approx 39058.58 - +2σ: 39200+2⋅141.42≈39482.8439200 + 2 \cdot 141.42 \approx 39482.84
39200 + 2 \cdot 141.42 \approx 39482.84 - -2σ: 39200−2⋅141.42≈38917.1639200 – 2 \cdot 141.42 \approx 38917.16
39200 - 2 \cdot 141.42 \approx 38917.16 - +3σ: 39200+3⋅141.42≈39624.2639200 + 3 \cdot 141.42 \approx 39624.26
39200 + 3 \cdot 141.42 \approx 39624.26 - -3σ: 39200−3⋅141.42≈38775.7439200 – 3 \cdot 141.42 \approx 38775.74
39200 - 3 \cdot 141.42 \approx 38775.74
- +1σ: 39200+141.42≈39341.4239200 + 141.42 \approx 39341.42
出力:
- 移動平均 (SMA): 39200.00 円
- +1σ: 39341.42 円
- -1σ: 39058.58 円
- +2σ: 39482.84 円
- -2σ: 38917.16 円
- +3σ: 39624.26 円
- -3σ: 38775.74 円
カスタマイズの提案
- グラフ表示: Chart.jsでバンドを可視化(価格チャート上に線を引く)。
- データインポート: CSVファイルアップロードで終値データを入力。
- リアルタイムデータ: 日経先物のAPIを統合(別途APIが必要)。
- 複数期間対応: 複数のn(例: 10, 20, 50)を同時計算。
- エクスポート: 結果をCSVや画像で保存。
注意点
- データ入力: カンマ区切りの数値を正確に入力(例: 39000,39100)。余計なスペースや文字はエラーの原因。
- データ数: 期間(n)以上の終値データが必要。不足するとエラーメッセージ表示。
- 精度: 標準偏差はデータ数が多いほど安定。短期データだと変動が大きい。
ピボットポイントのHTMLツールに続き、ボリンジャーバンドも実用的に仕上げました。もしグラフ追加や特定の日経先物データでのテストなど、さらなるカスタマイズが必要なら教えてください♪


